One dashboard for tracking the organisation’s key indicators, with data gathered automatically from several sources.
Overview
A management dashboard that brings the key indicators of different departments into one view. Data is extracted from internal systems and different databases, cleaned and prepared in a shared data warehouse, so reports always come from a single source.
The problem
Management reports were put together from scattered sources with different definitions. Comparing numbers between departments, and trusting them, took a lot of time.
The solution
ETL processes were built with SSIS so data from the source systems lands in a data warehouse on a schedule. Every indicator was defined once, in one place, and the Power BI reports and dashboards were built on that single model.
How I built it
- 01
ETL processes were built with SSIS so data from the source systems is collected into a data warehouse on a schedule.
- 02
Each indicator was defined once, in one place, and the Power BI reports and dashboards were built on that model.
Features
- Data gathered from several systems and databases
- Scheduled ETL process
- One shared definition for every indicator
- Power BI dashboards and reports
Result
Management has one reliable view of how the organisation is performing, and reports no longer contradict each other.
Technologies
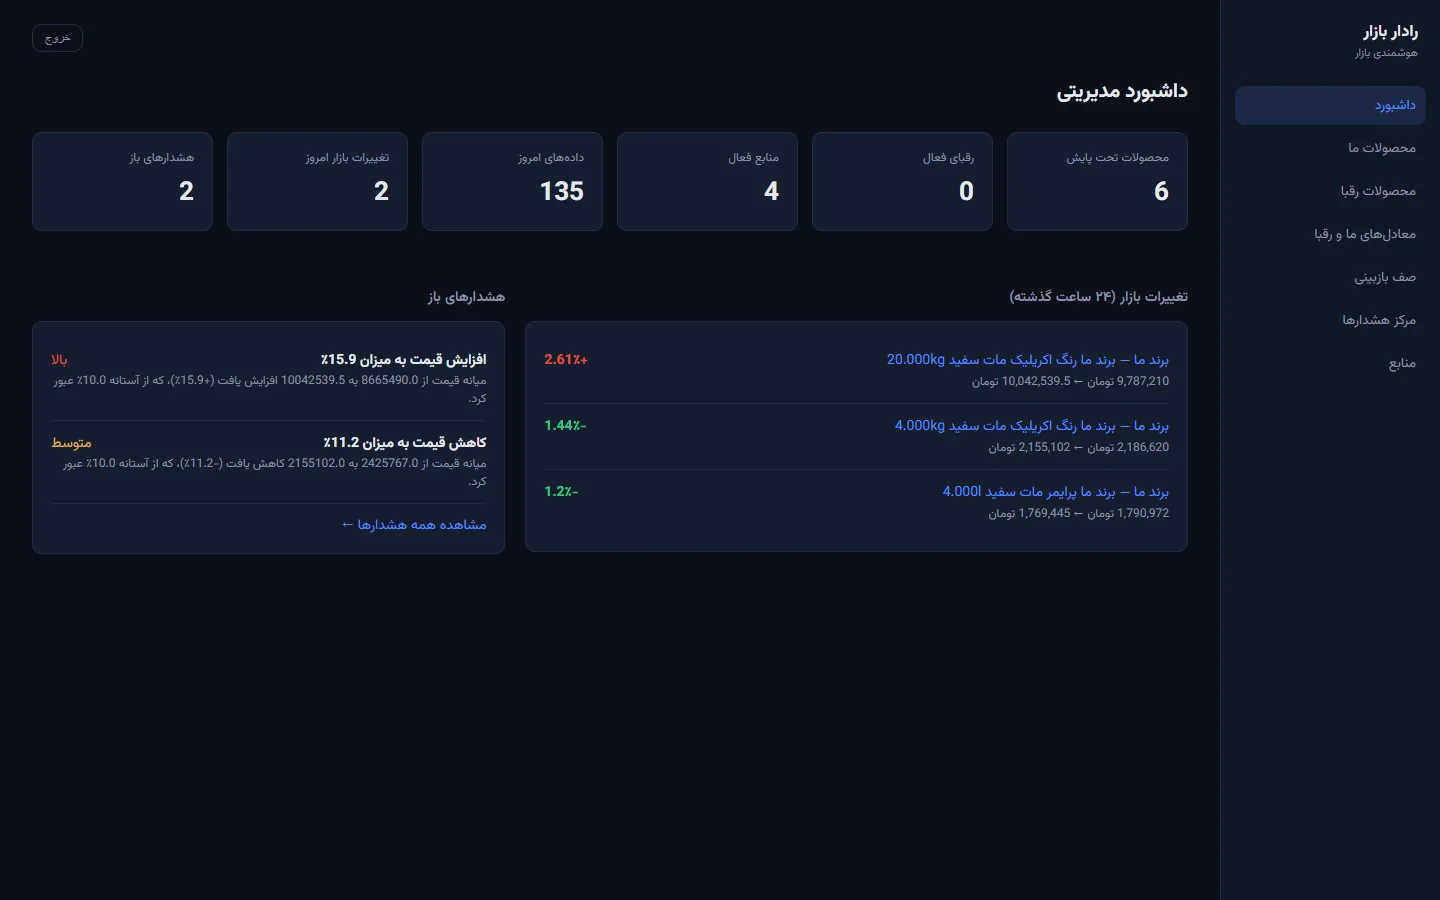
Market Radar: competitor price monitoring platform
A platform that collects competitors’ prices from online stores automatically, matches equivalent products and shows where the brand’s prices sit in the market. Every number can be traced back to its source.
View project details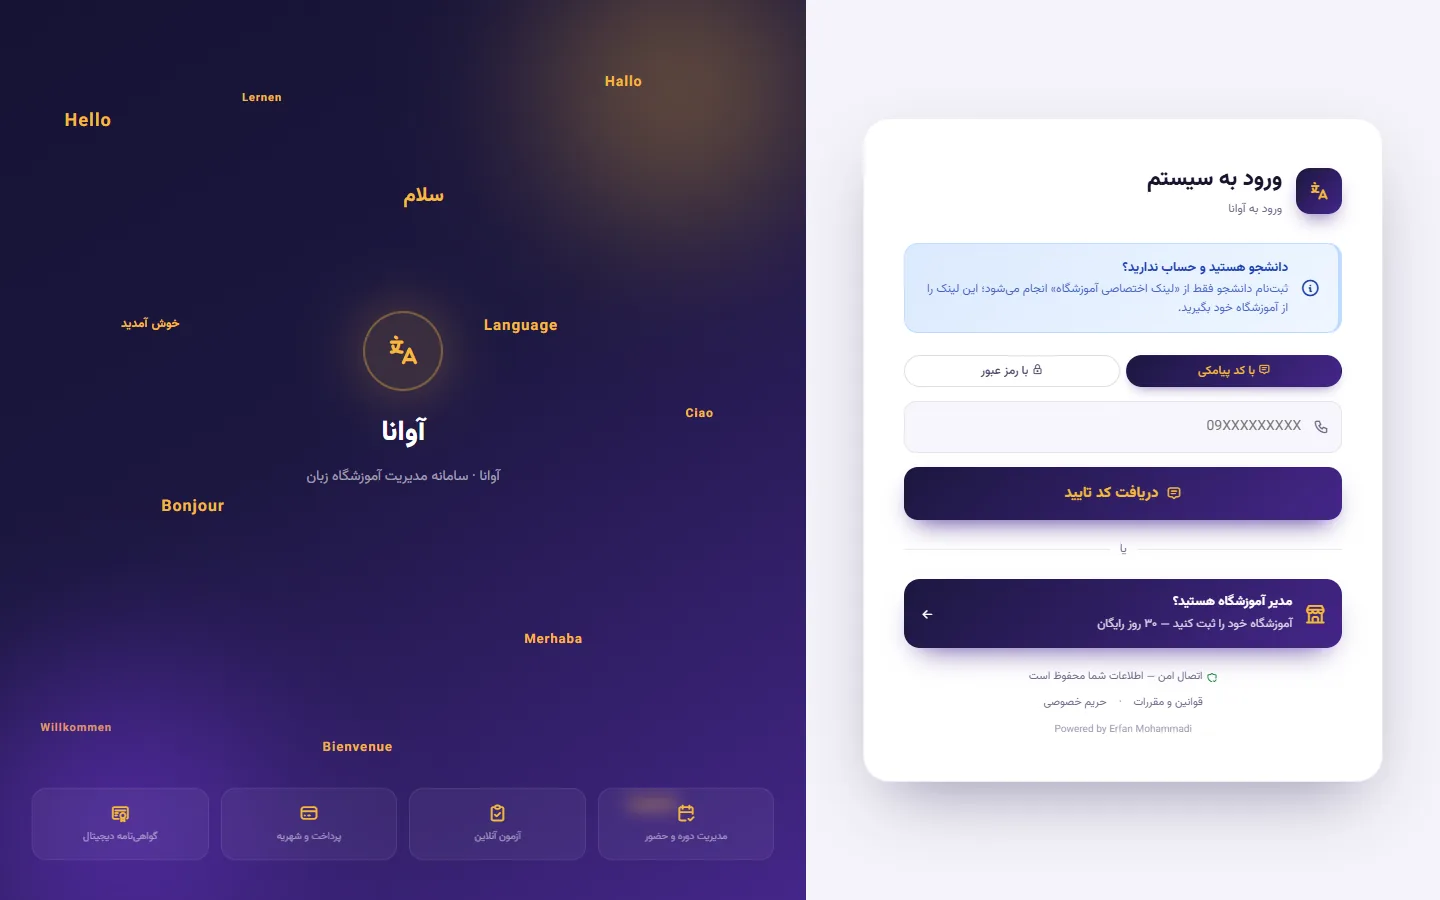
Avana: cloud management system for language schools
A ready-to-sell cloud product for language schools: students, teachers, classes, online exams, tuition, a video store and certificates. Monthly plans, a 30-day free trial and SMS login.
View project details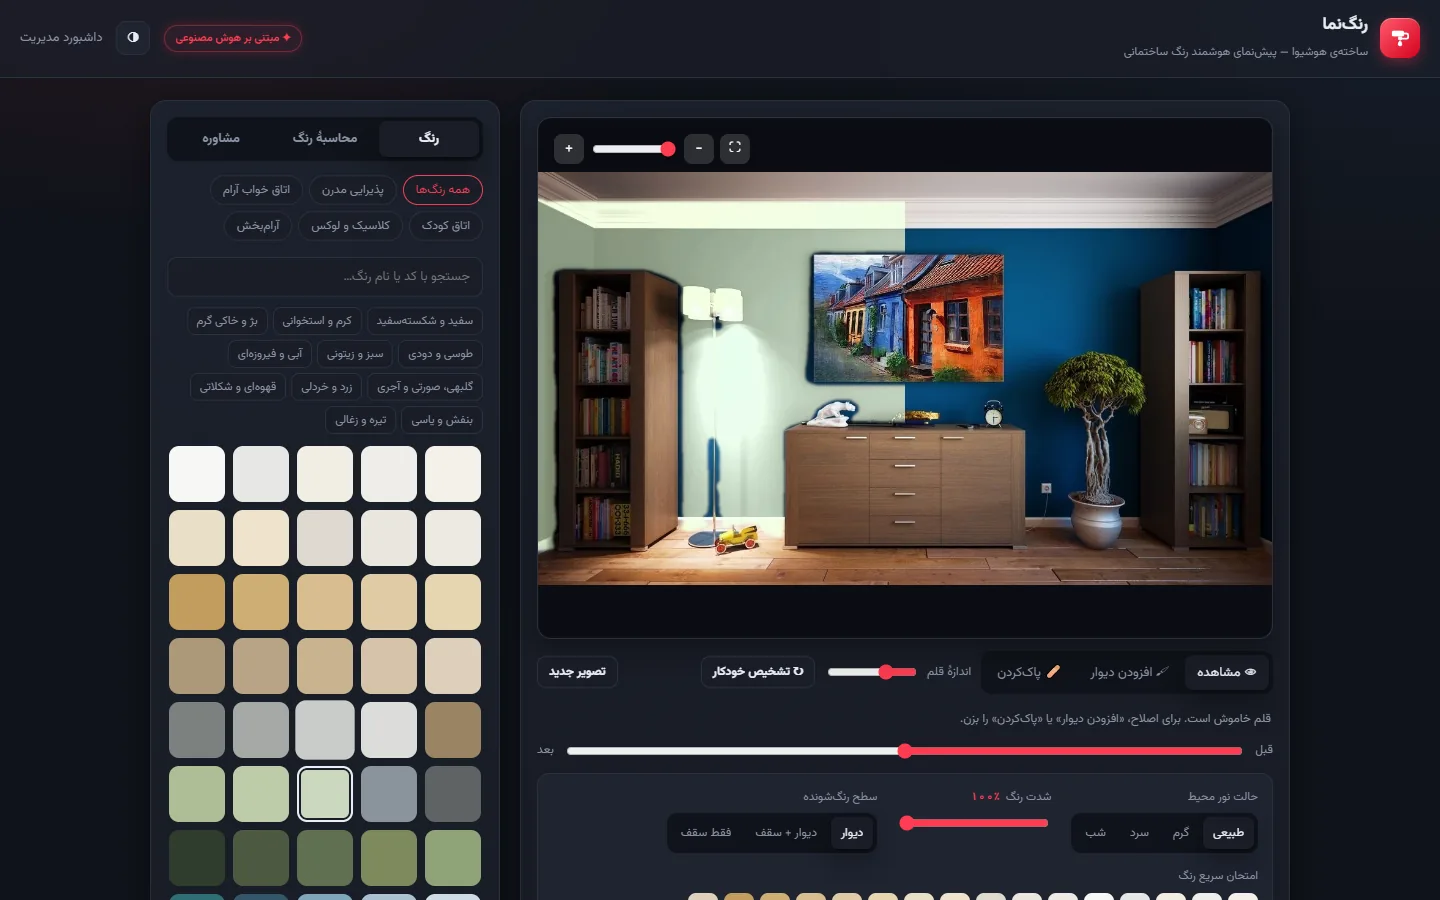
Rangnama: AI paint visualizer for buildings
A customer uploads a photo of a room or a building’s exterior. In a few seconds the AI finds the walls and paints them in the chosen colour, keeping the photo’s real light, shadow and texture.
View project detailsIf you need something similar or have an idea for custom software, let’s talk about it.